Today, I’ll be discussing my final project for BIOS823 that I worked on with Yue Han and Yi Mi. You can explore the deployed version of our project here, and the github repository for it is here.
Since this will be a longer post, let’s begin with an overview of what I’ll discuss:
Post overview
- Data product: what it is and what problem it addresses, its intended audience, purpose of analyses and visualizations.
- Details on the dataset used.
- Technical methods and tools used.
1. Data Product
1.1 Problem addressed by the data product
Currently, if you want to find out information about clinical trials, the standard reference is the clinicaltrials.gov website. If you search for trials of interest, it returns an (often large, very technical) giant table containing information on ongoing trials. Here’s an example (note these are not all the columns available):
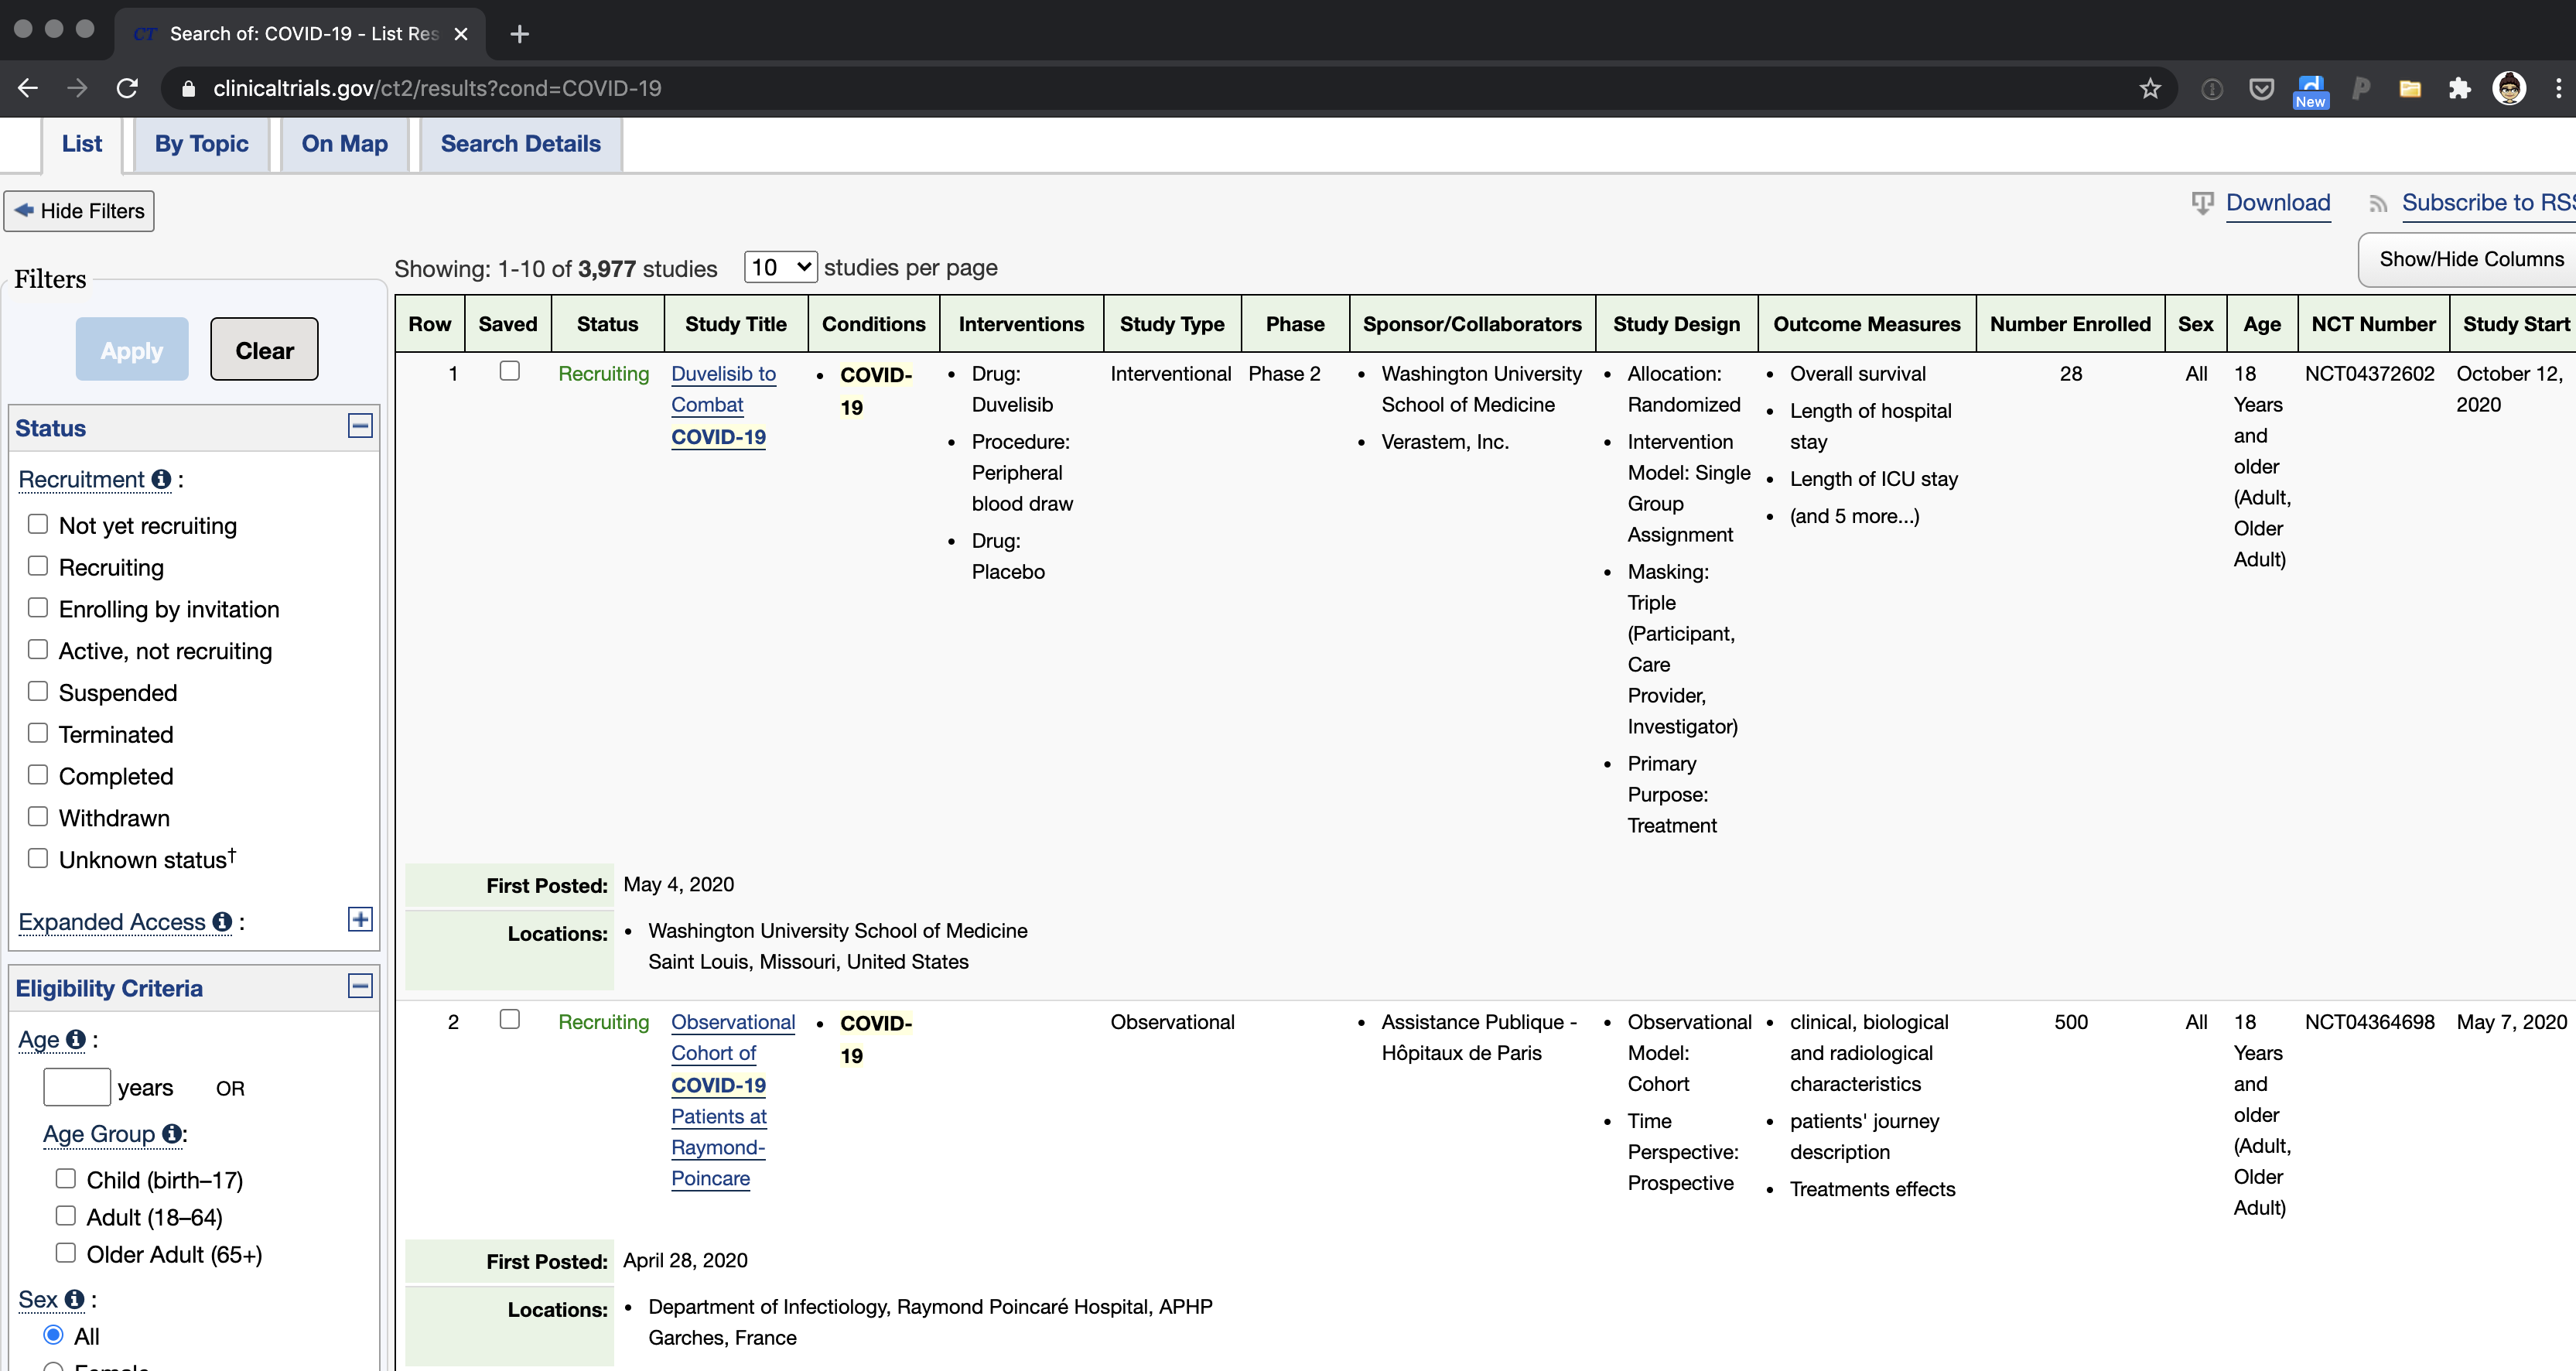
This is unwieldy, not a very pleasant user experience, and too technical for most people; however, for the most part (in normal times) most people probably don’t care to look through the details of clinical trials anyway.
Of course, these are not normal times– COVID-19 is spreading and impacting the entire world, and though recent preliminary data about a possible vaccine seem promising we are far from widespread vaccines being available. So, clinical trials hold a lot of promise (particularly for more severe COVID cases), and many people are understandably interested in what trials are happening and what they are about.
1.2 Data product developed
To address the increased interest in COVID-19 clinical trials, we decided to develop a pleasant to use dashboard with interactive visualizations and modeling results that enabled two main things:
- Exploration (hopefully in a fun way) of information relevant to all COVID19 trials happening globally
- A way for users to identify trials (in the United states) that are have locations & features relevant to them.
We did so through our dashboard, which has the following pages:
- Introduction: A brief description of the project
- World Trials: Tools to visualize and explore/filter COVID-19 trials happening globally
- U.S. Trials: Tools to visualize and explore/filter COVID-19 trials happening in the US. Worth noting for this page is that clinicaltrials.gov does not provide addresses of trials by default, so we added this by geocoding the location names (details on this in section 3). This helps users pinpoint where trials are specifically being held.
- Clustering trials by similarity: Exploratory unsupervised learning tool to see how/if trials are similar to each other.
- Predicting trials’ activity status: Exploratory supervised learning tool to see how different models predict the whether trials are open or closed.
1.3 Intended user
The intended user of this project are people in the U.S., who (we assume) might be interested in exploring and learning more about what COVID-19 trials are happening in general, and whether any of the trials happening (in the US) are relevant to them in some way.
One aspect of our intended user that’s important to note is that different parts of the data product require different levels of technical expertise; for example, we optionally enable users to tweak parameters of the machine learning models–a task that (to fully understand) requires some level of technical expertise–but also have interactive visualizations that should be clear to users regardless of their statistical/computational background. Consequently, we expect that the interactive visualizations conveying information will be accessible and of interest to all users, while the tools enabling exploration of predictive models will likely be accessible/of interest to a subset of these users. We assume that people can choose to interact more with parts of the dashboard they’re interested in (and less with those they’re not), and so we included both technical and less technical features.
1.4 Purpose of visualizations available
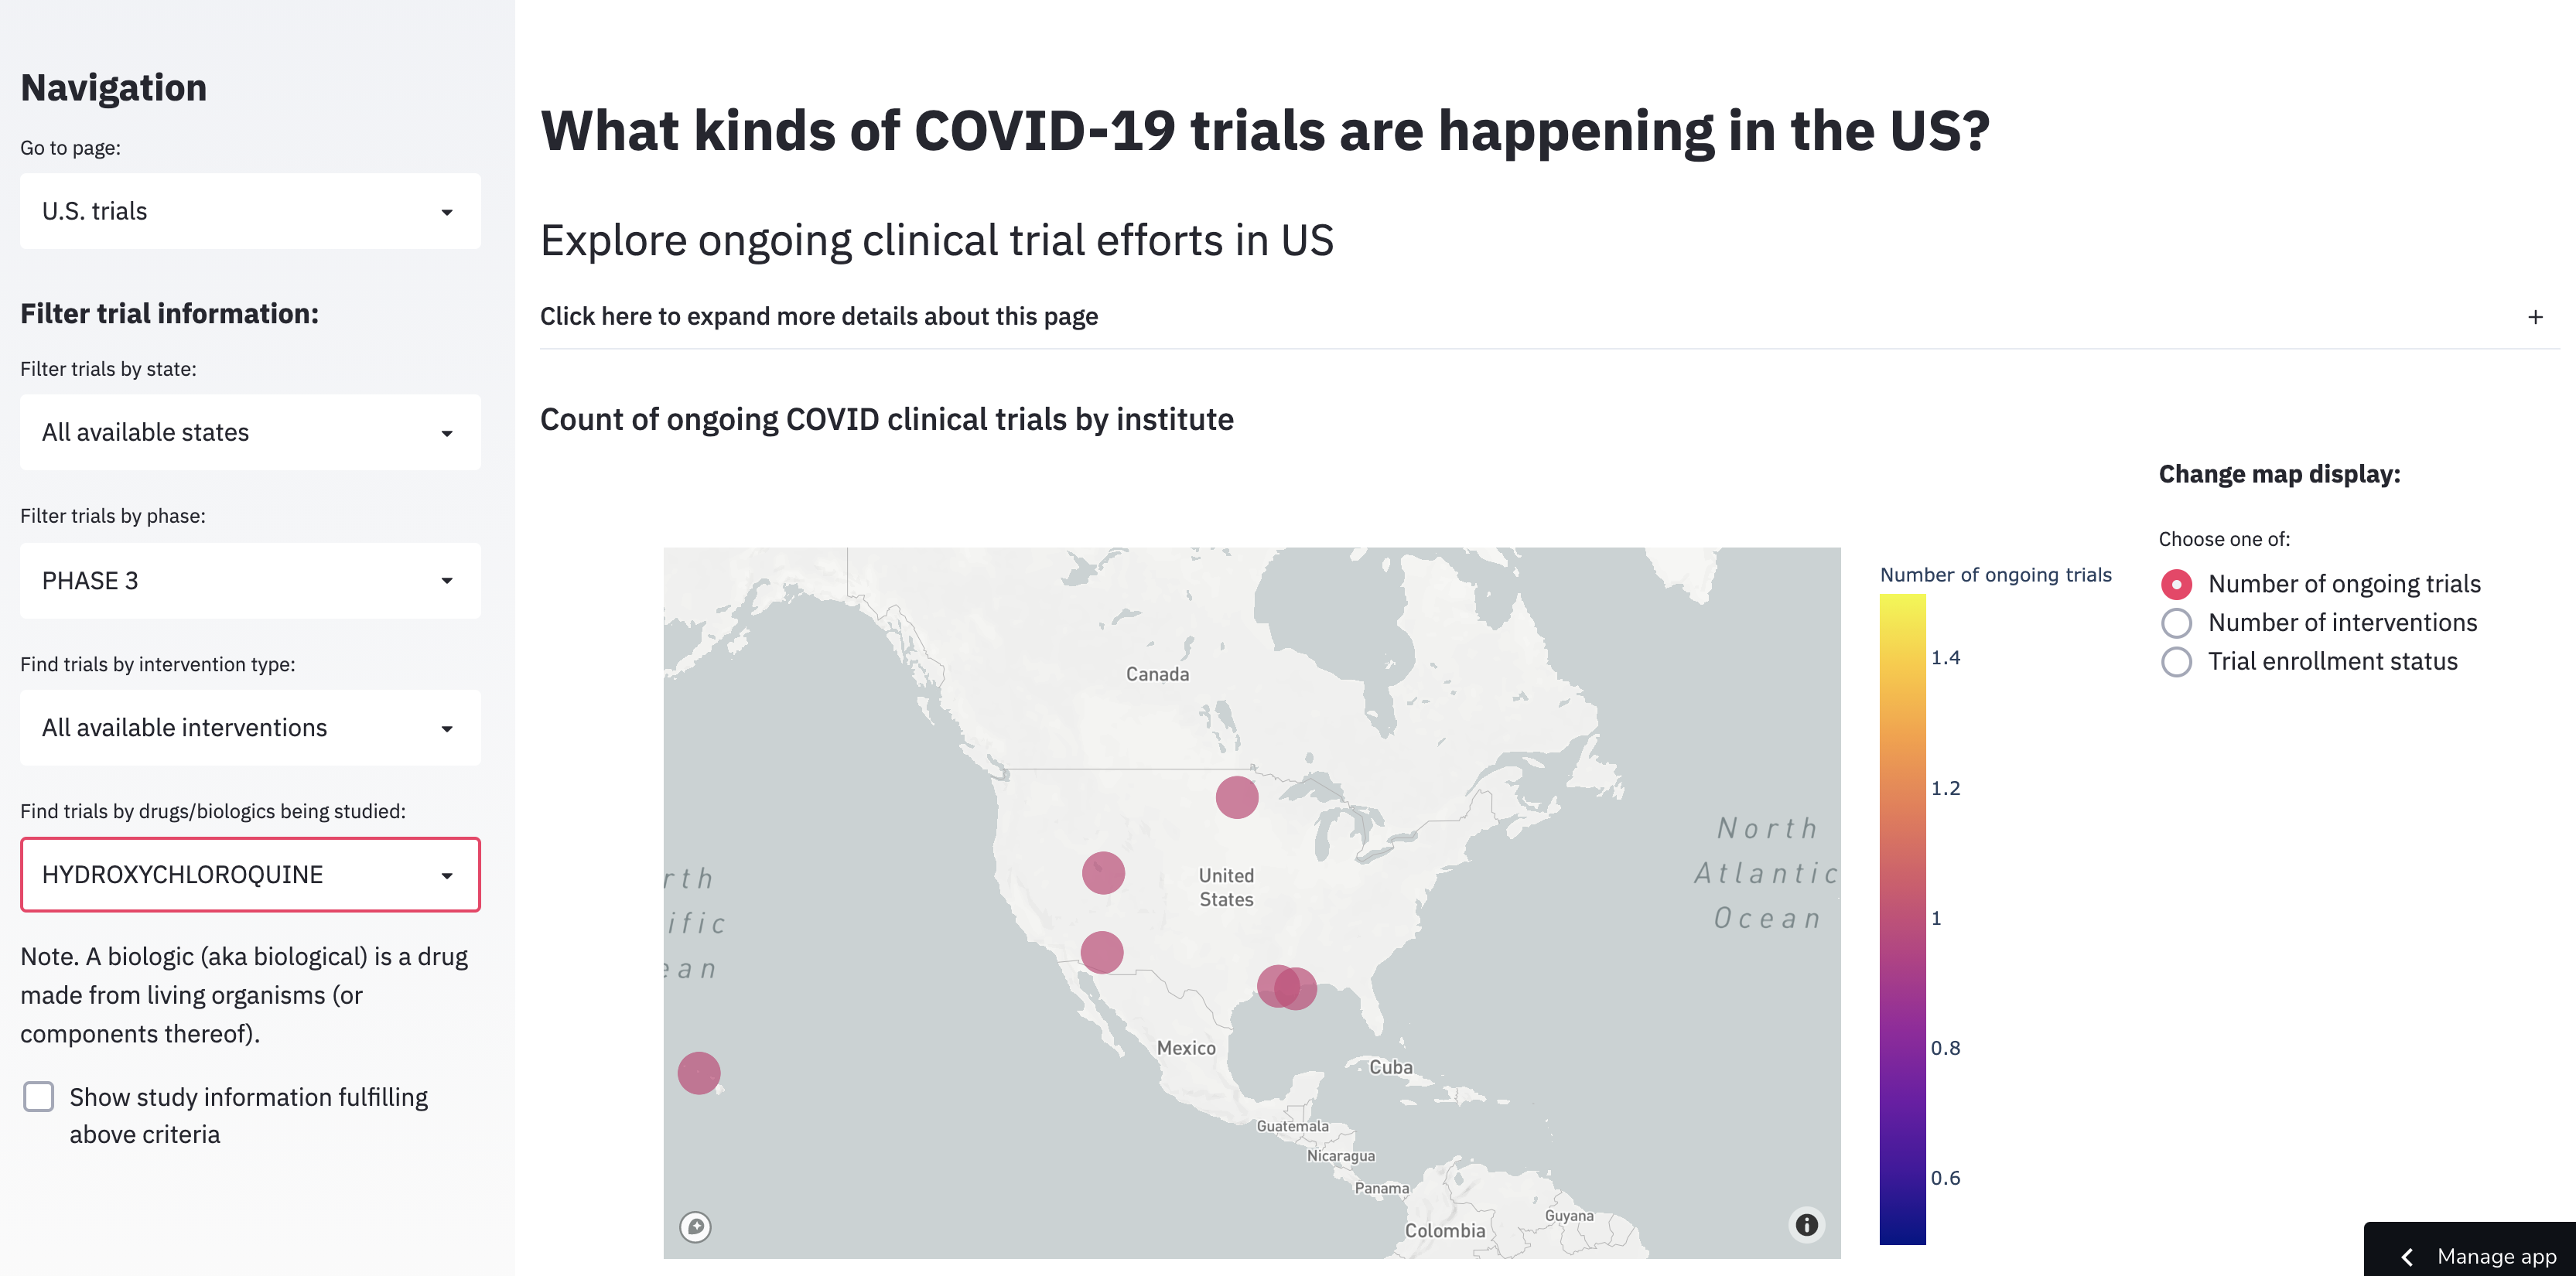
Given that a major goal of this dashboard was to display relevant trial information for users in the United States, we wanted to have simple but customizable visualizations that helped users easily answer common questions they might have about these trials (all by location): how many trials are happening? What and how many interventions are being considered? Are the trials open to enrollment?
For example, here’s what it would look like if someone was interested in Phase 3 trials involving hydroxychloroquine (note. Per the FDA this is NOT recommended; I use it as an example because it was in the news frequently and might be more familiar to many:
1.5 Purpose of analyses available
Besides filtering and grouping by different combinations of the data available, there were two main analyses additionally available.
1.5.1 Clustering trials into groups by similarity
This corresponds to the “Clustering trials by similarity” page.
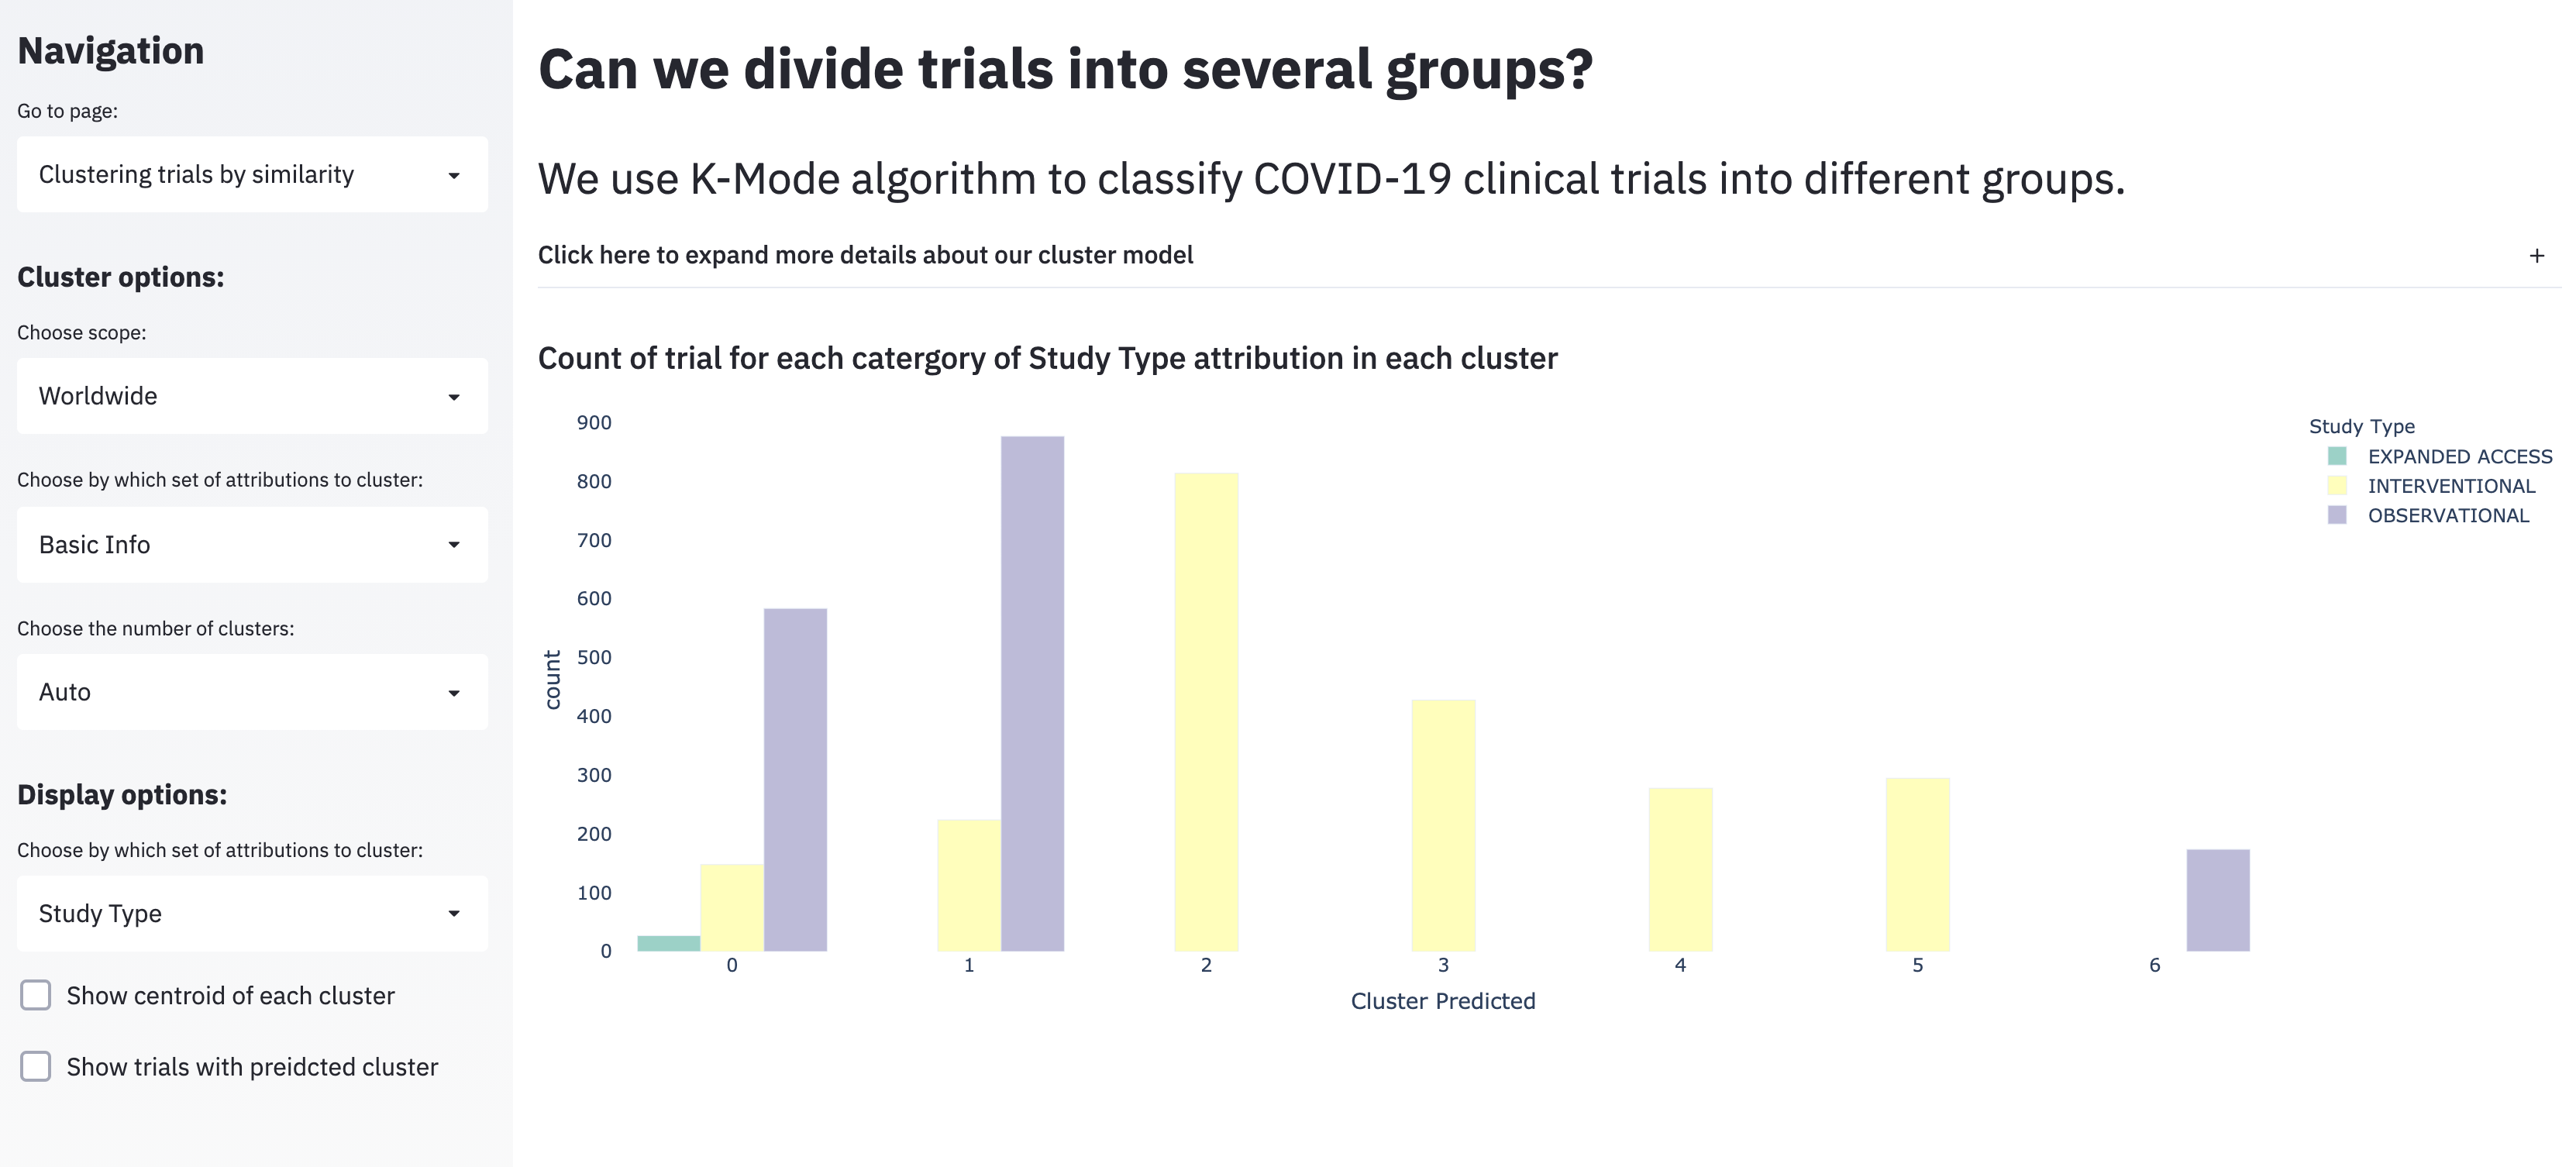
A reasonable question to ask of the thousands of ongoing COVID-19 trials is which of these trials are most similar? However, to answer this two issues need to be addressed: first, most of the data about the trials are categorical with many levels, and second, it’s unclear how you would split trials into groups (the obvious choice here would be to either define groups in a data-driven way–probably after clustering–or to predefine the number of groups).
If you define the number of groups a beforehand (as we did in the dashboard), then K-modes is one approach that can be used to cluster categorical data to get at that question. K-modes is a variation on standard K-means clustering that is optimized for use with categorical data; instead of the Euclidean distance between points that K-means uses, K-modes minimizes a dissimilarity measure (basically, counting the number of features that aren’t the same).
Three clear limitations of K-modes are:
- Like K-means, the choice of K matters to model performance. This is somewhat addressed in the dashboard by providing the user the option to change K.
- In evaluating dissimilarity, K-modes doesn’t care which features are different; this might become a problem, because (particularly in cases where one category is more common) the algorithm won’t take it into account for clustering.
- It’s a little hard to interpret the groups to clear features; I suspect this is in part due to the complex nature of the data, in part due to the visualization, and possible other factors as well. The data is what it is, but I personally think it could also be interesting (and maybe more interpretable) to superimpose cluster assignments on a visualization more consistent with those used to convey trial information (however, there was disagreement in the larger group about this).
Lastly, one possible alternative to this approach that would be useful to try in the future would be hierarchical clustering; though it doesn’t pre-define cluster groups, if you wanted to have discrete groups you could define them based on the cut points you choose. Also, there’s an argument to be made that the results of hierarchical clustering are more intuitive to look at (though this is a matter of opinion).
1.5.2 Comparing classifiers that predict trial activity status (open vs. closed)
This corresponds to the “Predicting trials’ activity status” page.
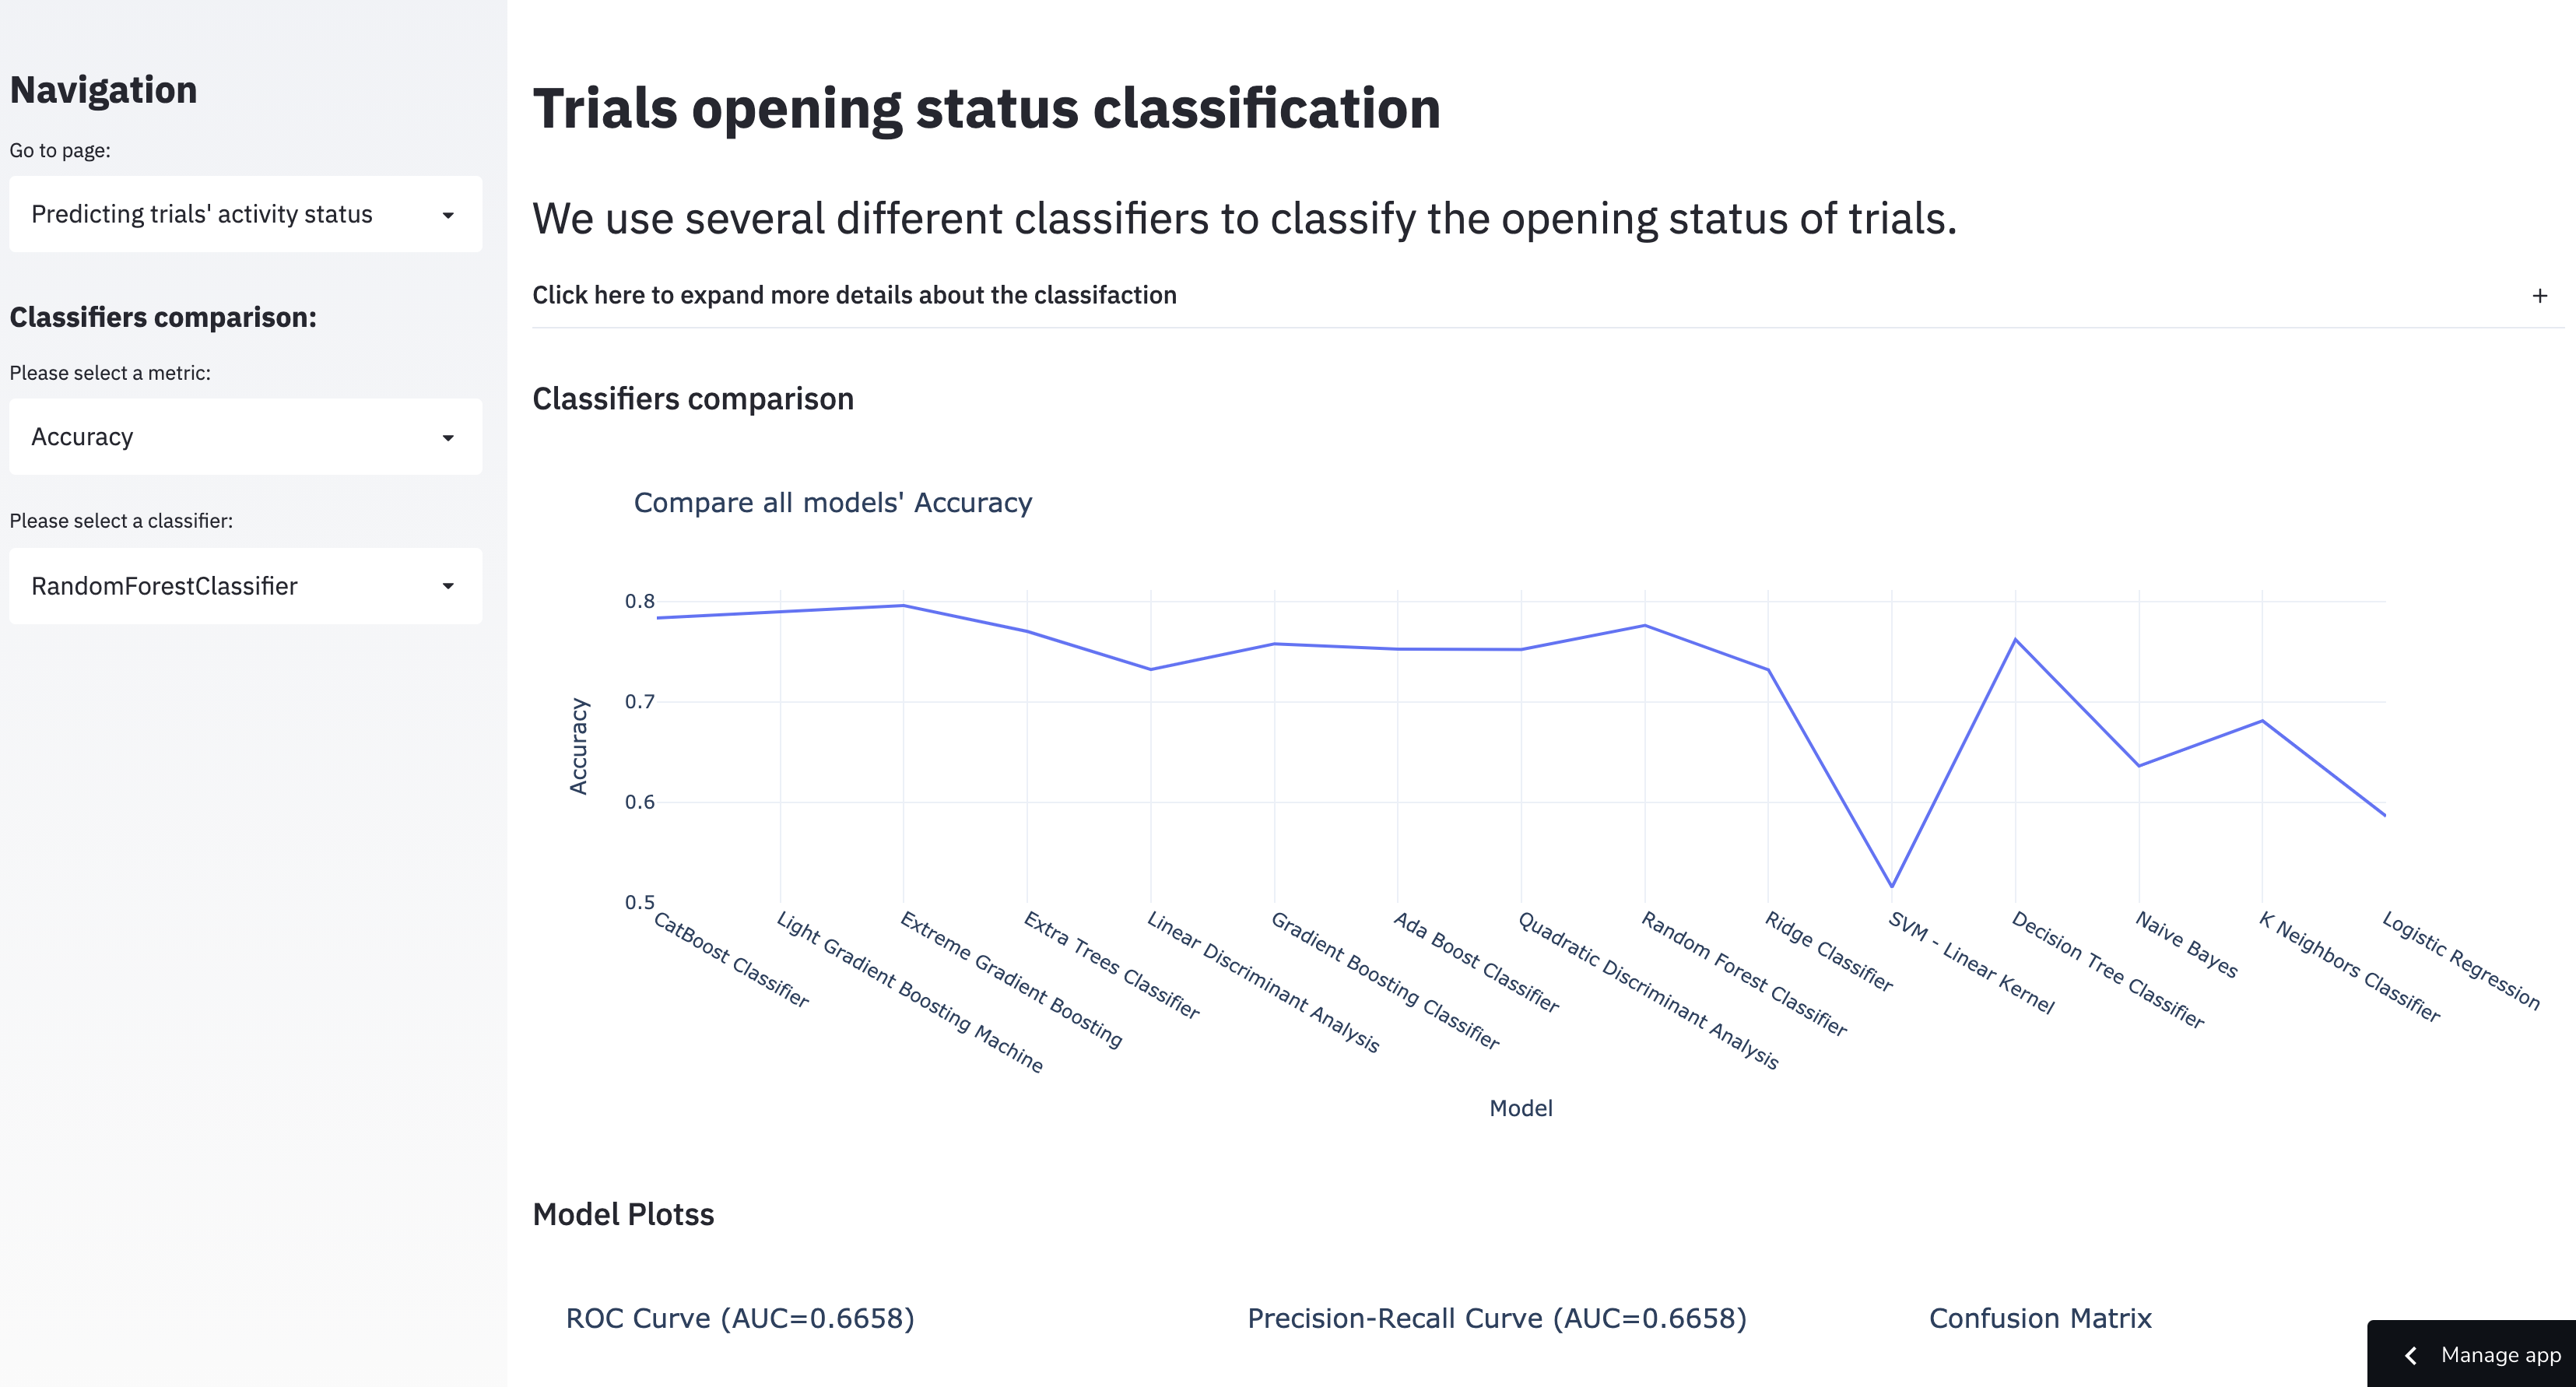
An important thing to note up front about this set of models is that predicting trial activity (if a trial is open or closed) is a purely academic exercise, since the labels for this are provided in the clinical trials data set already. However, in the spirit of exploring the dataset we included this as a tool as well, and made the tool about as exploratory as it could be– the user can choose any classifier algorithm and/or metric they may be interested in.
The obvious limitations of this is first that it doesn’t actually answer any new question about the data set, as you can just look up trial activity in the data itself and second that it’s very technical. Personally, I think (given the dashboard’s stated goals) that this could be also work and/or be more appropriate as a standalone tool separate to the dashboard.
2. Details on the dataset used
The data used for this was a table of all COVID-19 related trials
downloaded from clinicaltrials.gov. This data was both very dense in
content and fairly messy, so before exploring it we spent a considerable
amount of time doing data cleaning. We also made the choice to
specifically not include all fields available in this table by
default, because we found it to be overwhelming and overly
detailed/technical for the typical user (however, you can download the
data from the app in the US Trials page to see more details, which
provides URLs back to the relevant page/s on clinicaltrials.gov itself).
From the data fields that would be useful/relevant to people in the US,
we tried to make them as clear and accessible as possible.
3. Technical methods and tools used
By category, methods and tools used were:
Environment:
condapipreqs
Version control:
git
Data cleaning & setup:
pandasgeopy(for geotagging locations listed in the data set)
Visualization:
plotlymapbox(with plotly; for getting geographical data)geopandasseaborn(for exploratory analyses)matplotlib(for exploratory analyses)
Modeling:
kmodessklearn(several models)catboost
Dashboard setup & deployment:
streamlitstreamlit sharing